- Published on
Generating code coverage report in Jest
- Authors

- Name
- Aleksandar Zeljković
- @a_zeljkovic
Code coverage is one of the most controversial topics in the development community. Some people would say it is an extremely important metric in software development, some would say it’s completely misleading, and others would even say it’s absolutely destructive and needs to be forbidden by law. My experience has shown that generating a test coverage report per se cannot bring a lot of value. Whether this metric will bring value or bring frustration and pain, depends on the team culture and the approach to coverage information processing. If test coverage is enforced with some additional analysis about the quality of tests, defect clustering, and other parameters that can complement this metric, you can get at least a clue on where you should add more tests. Anyhow, I will tackle this topic in a dedicated blog post, and next I’m going to show you how to generate a test coverage report in a Jest testing framework.
Introduction
As a demonstration code for this article, I’m going to use Oleksii Trekhleb’s javascript-algorithms repository. This repo is an awesome set of JavaScript implementations of the most famous algorithms (sorting, search, graphs, math algorithms, etc.) and data structures (heap, stack, queue, etc.), so besides learning how to generate a test coverage report in Jest, you’ll have a chance to learn some interesting JS tips and tricks.
If we take a look at the package.json file, we can see the following lines of interest:
- dependencies:
"@types/jest": "m.m.b"– type definitions for Jest (optional)"eslint-plugin-jest": "m.m.b"– eslint plugin for Jest (optional)"jest": "m.m.b"– Jest testing framework
- scripts:
"test": "jest"– run tests"coverage": "npm run test -- --coverage"– run tests and generate coverage report
Next, let’s install dependencies by running npm install. As soon as this is done we can run npm test to check if we are able to run all tests. Finally, let’s generate the test coverage report by running npm run coverage. That’s it, we have the code coverage report! As you have seen, the simplest solution to generate a coverage report in Jest is adding the --coverage flag to the test execution command. Before we proceed to advanced configuration, let’s check the structure of the coverage report.
Coverage report structure
As soon as the test job with the coverage flag is done, two forms of the report are available:
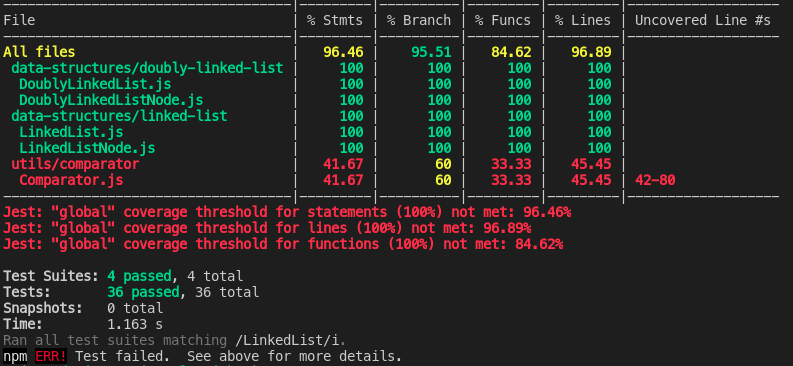
- Console report, which is instantly available to the user in the same command line where the test is executed. This report is convenient for a quick overview of the coverage results:
- HTML report, generated in the location set in jest.config.js:
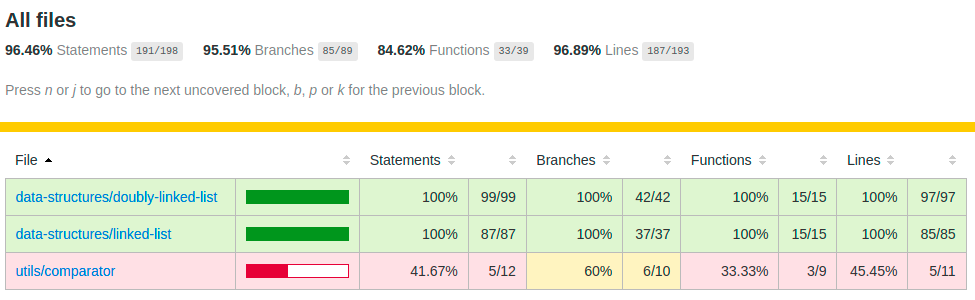
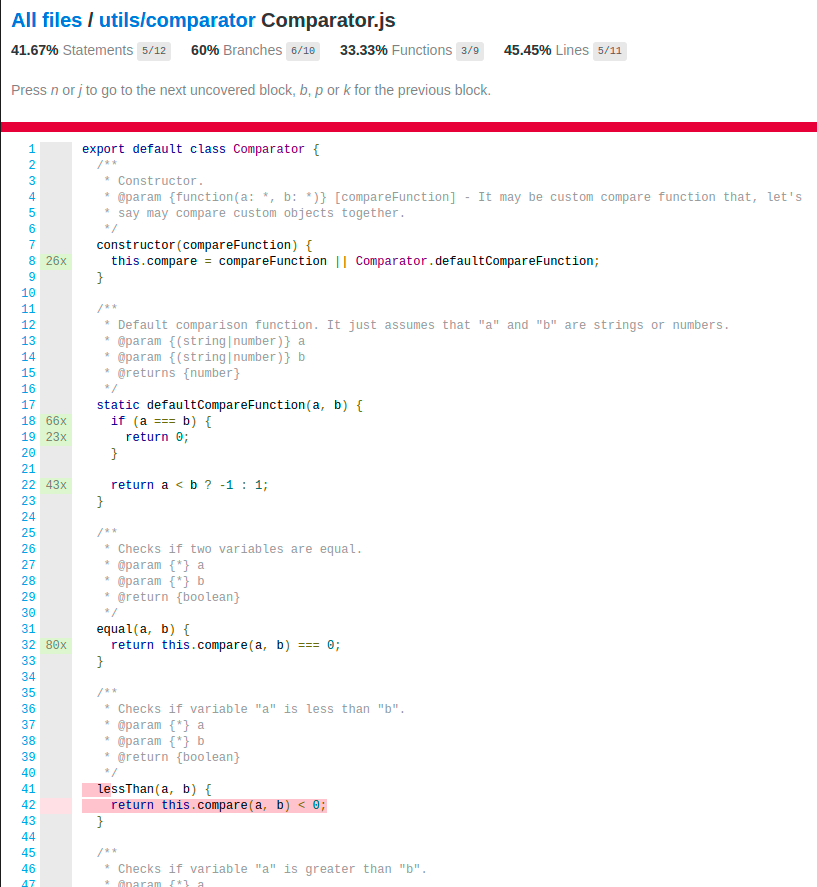
This report gives more details and a better overview of what is covered with tests:
From the images above, we can see that the coverage report provides the following information:
- coverage per module/submodule/file
- statement coverage
- branch coverage
- function coverage
- lines coverage
- uncovered line #
- uncovered part of the code For the coverage report Jest is using Istanbul (https://istanbul.js.org) under the hood, which is a general javascript coverage calculation tool.
Configuration
Jest documentation is not very generous when it comes to code coverage information, so don’t expect much from it. Most of the things related to code coverage are command-line arguments and configuration parameters. You can configure the reporting capabilities via three command-line arguments:
--collectCoverageFrom– choose the folder that contains tests for the coverage report--coverage– an indication that coverage should be collected--coverageProvider– choose the coverage provider: babel (default) or v8
Besides the CLI arguments, Jest can be additionally configured through the Jest configuration file (jest.config.js/jest.config.ts). When it comes to code coverage, the following can be configured:
collectCoverage– same as –coverage argumentcollectCoverageFrom– same as –collectCoverageFromcoverageDirectory– the location where the coverage report will be savedcoveragePathIgnorePatterns– regex patterns that will define which folders should be ignoredcoverageProvider– same as –coverageProvidercoverageReporters– reporter/reporters that will be used for reporting (list of supported reporters can be found here)coverageThreshold– object which defines the code coverage thresholds for a certain module (folder/file) through the values for a certain coverage type (branches/functions/lines/statements). The purpose of this parameter is to maintain a certain coverage level, since if the coverage goes below/above the threshold value (you can see the example on the Command-line coverage report image above), the test job will fail. The threshold can be set in two ways: if the number has a positive value it’s interpreted as a coverage percentage; if the number has a negative value then it’s interpreted as a number of uncovered branches/functions/lines/statements. You can see an example of the jest.config.js file in our demo javascript-algorithms repository:
module.exports = {
  // The bail config option can be used here to have Jest stop running tests after
  // the first failure.
  bail: false,

  // Indicates whether each individual test should be reported during the run.
  verbose: false,

  // Indicates whether the coverage information
  // should be collected while executing the test
  collectCoverage: false,

  // The directory where Jest should output its coverage files.
  coverageDirectory: './coverage/',

  // If the test path matches any of the patterns, it will be skipped.
  testPathIgnorePatterns: ['<rootDir>/node_modules/'],

  // If the file path matches any of the patterns,
  // coverage information will be skipped.
  coveragePathIgnorePatterns: ['<rootDir>/node_modules/'],

  // The pattern Jest uses to detect test files.
  testRegex: '(/__tests__/.*|(\\.|/)(test|spec))\\.jsx?$',

  // This option sets the URL for the jsdom environment.
  // It is reflected in properties such as location.href.
  // @see: https://github.com/facebook/jest/issues/6769
  testURL: 'http://localhost/',

  // @see: https://jestjs.io/docs/en/configuration#coveragethreshold-object
  coverageThreshold: {
    global: {
      statements: 100,
      branches: 95,
      functions: 100,
      lines: 100,
    },
  },
};
From this config file, we can see that coverage will not be collected automatically (collectCoverage: false), the report will be generated in the coverage directory (coverageDirectory: ‘./coverage/’), node_modules folder will be excluded from the scan (coveragePathIgnorePatterns: [‘/node_modules/’]), and the job will fail if statement/function/line coverage gets under 100% or branch coverage gets under 95%.
Conclusion
As we have seen above, Jest provides a simple and straightforward way to generate a code coverage report. Code coverage report for the whole repository can be generated by simply appending –coverage flag to the test execution command. If you spent a couple more minutes playing with jest.config file, you can tune the report location, thresholds, include/exclude files and fully utilize Jest’s coverage reporting utility.
Useful links
https://github.com/trekhleb/javascript-algorithms
https://jestjs.io/docs/cli#–collectcoveragefromglob
https://jestjs.io/docs/configuration#collectcoverage-boolean